Introducing how to display a portfolio of US stocks using TradingView, the world’s best in class charts and analysis tools. Did you know that you can actually display a stock chart that combines multiple stocks?
By using this function, you can easily check the past transition of your portfolio and the portfolio you are interested in.
Preparation & Condition
In this example, MAGA, that is
M: MSFT Microsoft
A: AAPL Apple
G: GOOG Google
A: AMZN Amazon
Consider an example of investing the same amount ($ 25,000 each, Total USD100,000) at the beginning of October, 2019.
You can pick up 10/1 data from each stock chart or historical data, but this time we will get the stock price data and the number of open positions with the following Python code.
Data acquisition
!pip install yfinance --upgrade --no-cache-dir
import numpy as np
import datetime
import yfinance as yf

start = datetime.date(2019,10,1)
end = datetime.date.today()
codelist = ["SPY","MSFT","AAPL","GOOG","AMZN"]

data2 = yf.download(codelist, start=start, end=end)["Adj Close"]

display(data2.head(1))
display(round(25000/data2.head(1)))
display(round(25000/data2.head(1)).values*data2.head(1))
Above is working at GoogleColab at 2021/08/25
From Yahoo US
codelist = [“SPY”, ”MSFT”, ”AAPL”, ”GOOG”, ”AMZN”]
Get the data from 2019/10/1 of the stock of.
We will round off how many shares you need to open to reach $ 25,000.
Multiply the number of open interests and the stock price to check the actual investment amount. The actual results are as follows.
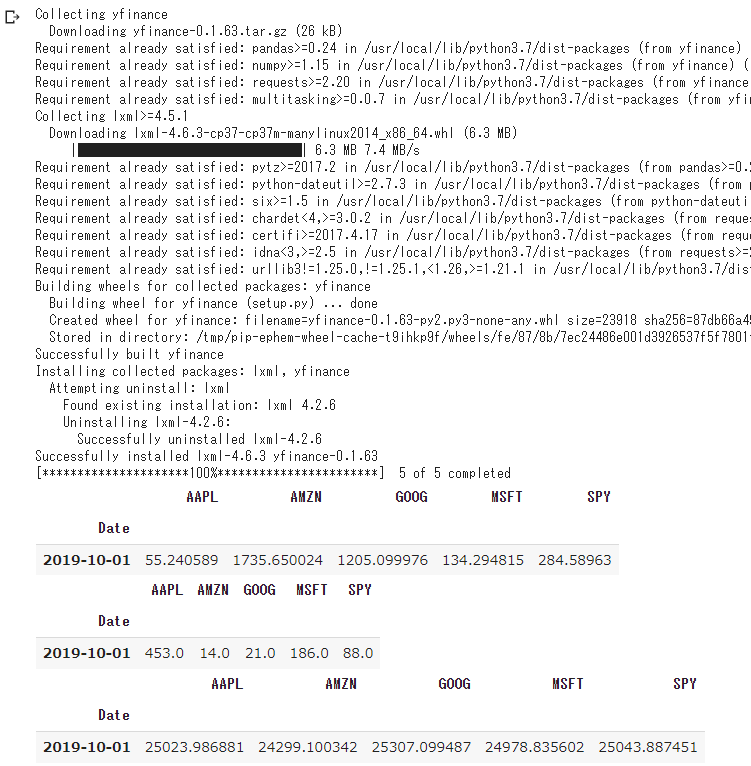
In other words, to invest an equal amount of $ 25,000 in each of the four stocks as of October 1, 2019.
Apple 453 shares
Amazon 14 shares
Google 21 shares
Microsoft 186 shares
We need to have a open position above.
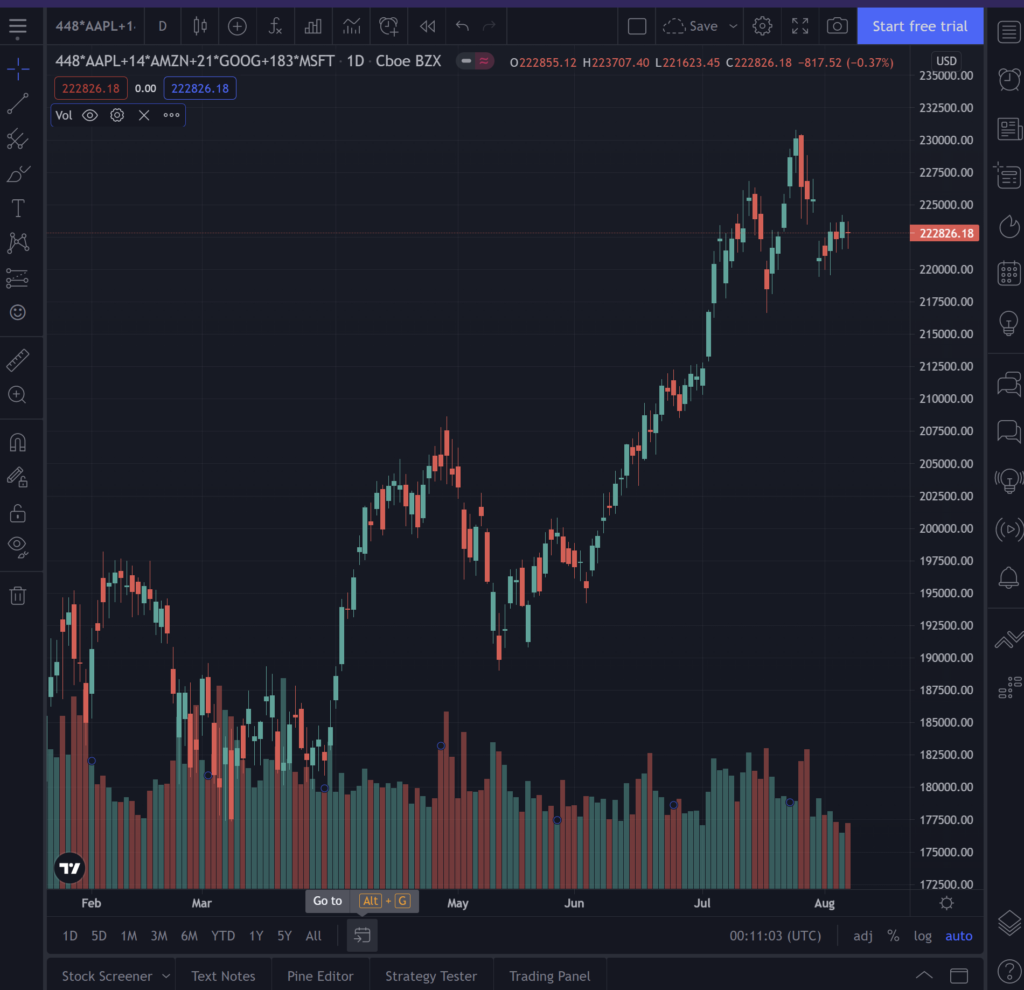
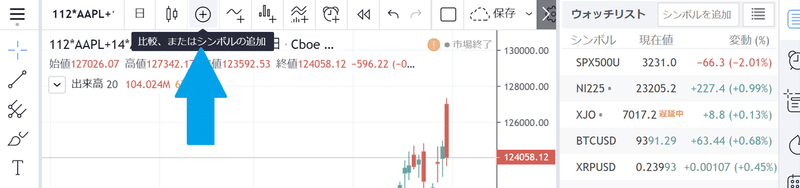
To display the portfolio above in TradingView, just type the symbol code, below:
453AAPL+14AMZN+21GOOG+183MSFT
To compare the S&P500 ETF (SPY), SPY open position must be quadrupled.
344*SPY
How to input on TradingView
TradingView site
https://jp.tradingview.com/chart/?symbol=TVC:NI225
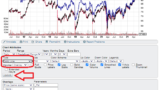
Access and enter the code in the upper left part of the figure below
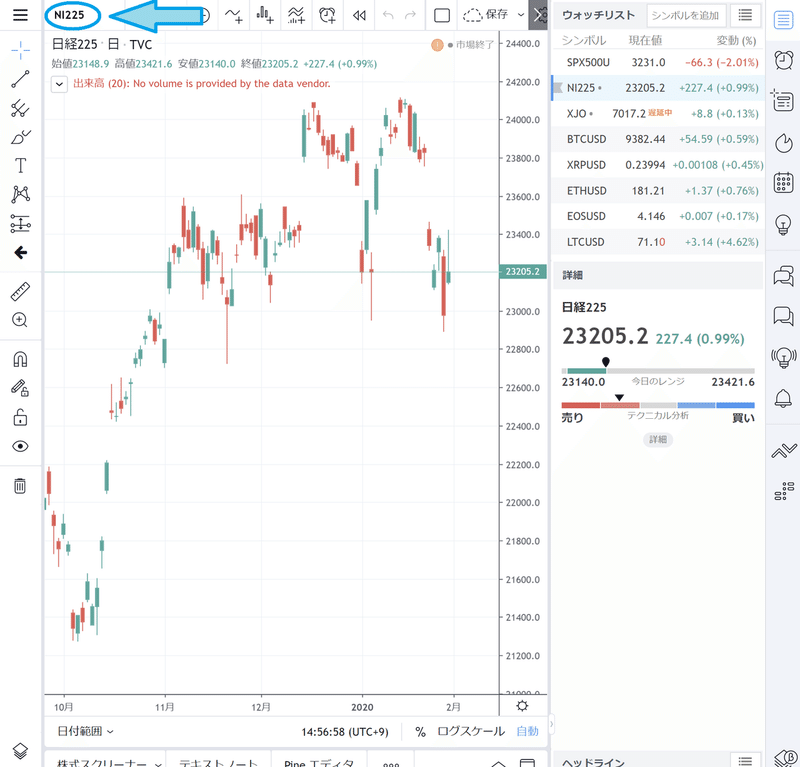
448*AAPL+14*AMZN+21*GOOG+183*MSFT
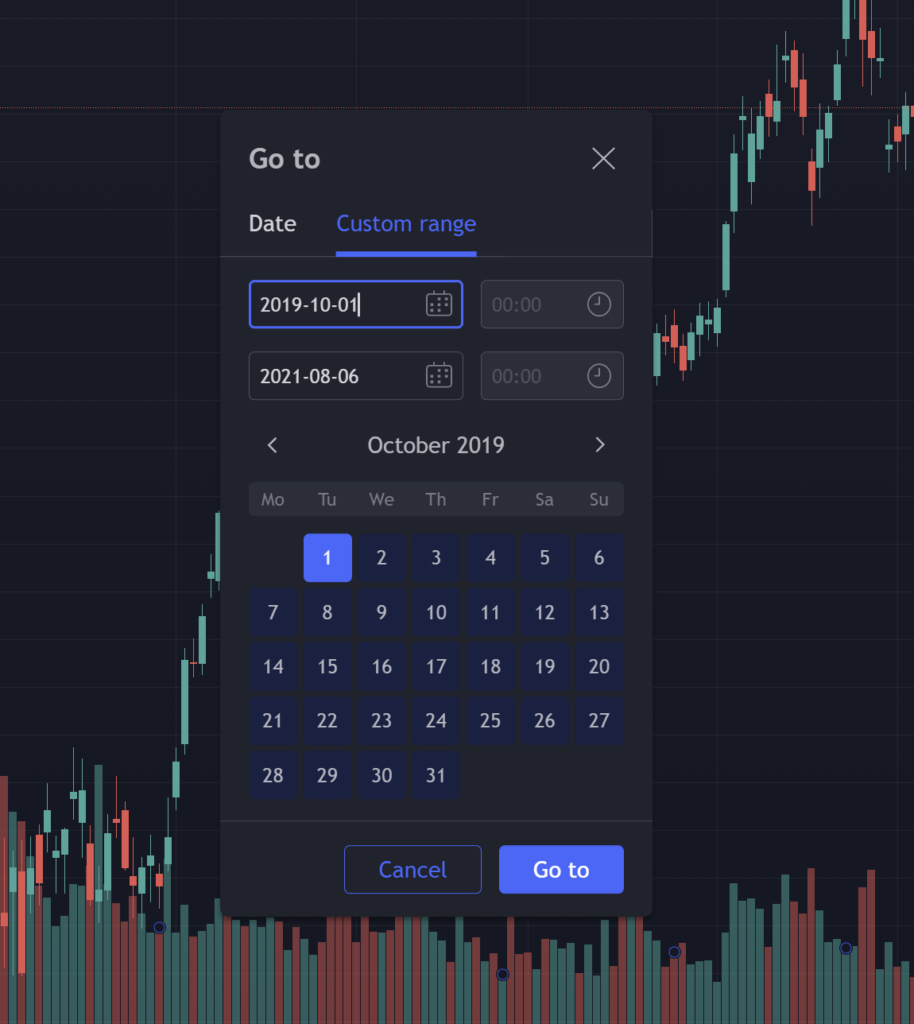
Range Setting
From 2019/10/01 to 2021/08/06.
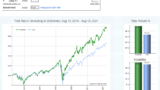
Display of comparison target (SPY: S&P500 ETF)
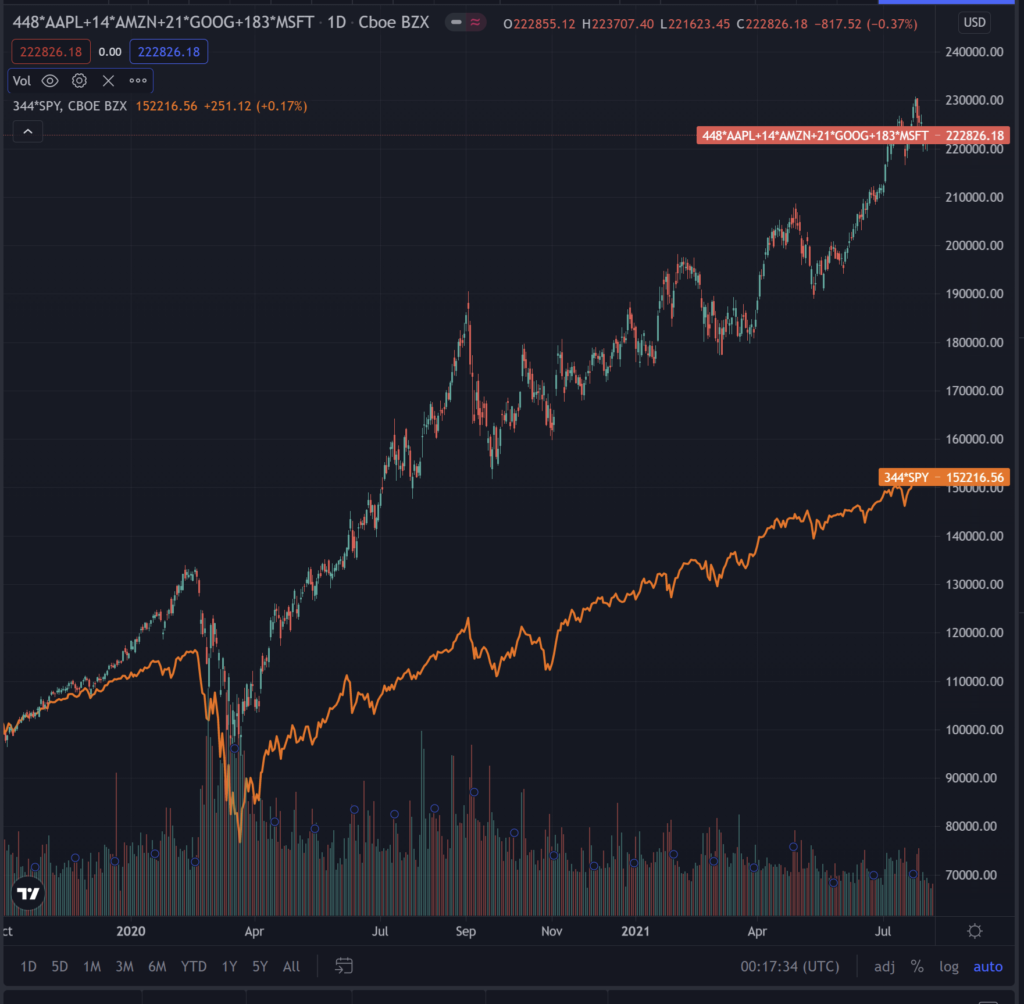
the MAGA portfolio performed better and seems to have widened further.
Simple Buy & Hold strategy (excluding dividends), from 100,000 to
MAGA : 222,000
S&P500 ETF : 152,000
Actual display using TradingView
Conclusion
It can only be done with about 10 symbols, t is easy to see how much drawdown has occurred, and how it has moved in a specific period.
Those who are reading this article, might already know that there is a considerable performance difference between S&P5 and S&P495.
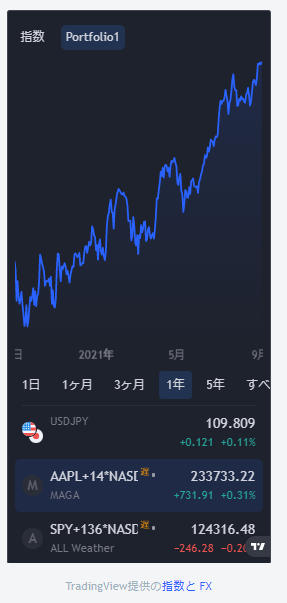
TradingView widget is available. You can check the daily price movements of MAGA on the Portfolio 1 tab.
Japanese page is
ーーー


コメント